Buy Now or Wait? Metrics to Frame Your Next Home Purchase
Field Note: September 2022
In an effort to curb rising inflation, The Federal Reserve continues to raise interest rates. This makes it more expensive to borrow and lowers the supply of money in the economy. While increasing interest rates impact our entire economy, they can be particularly hard-felt for buyers in the real estate market.
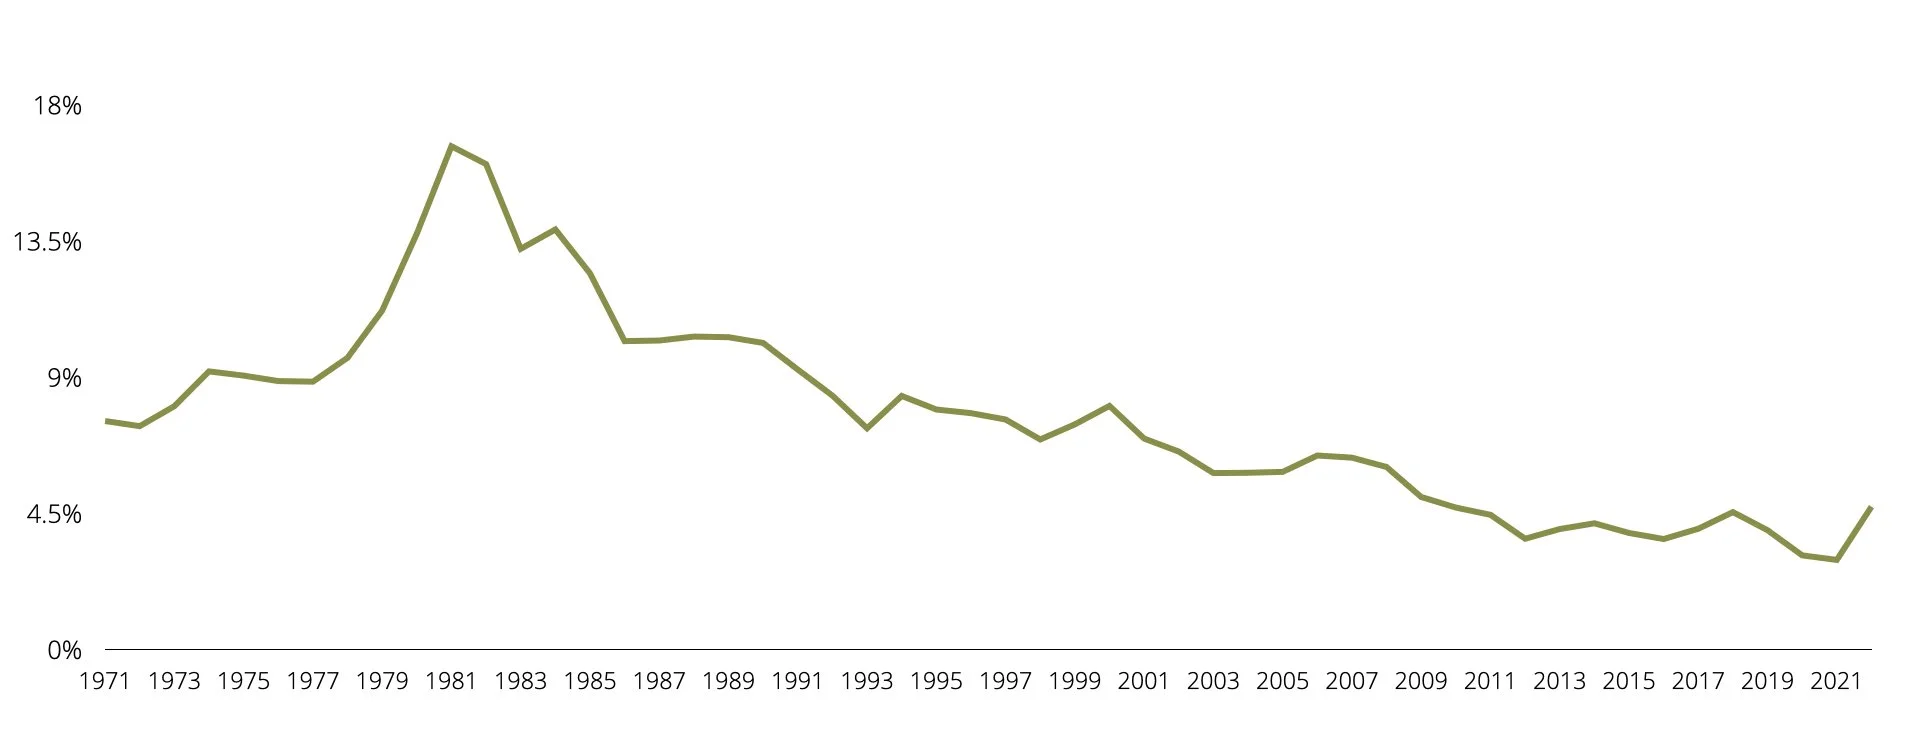
A year ago, interest rates for new home buyers were around 2-3%. Today those interest rates have jumped to 5-6%.1 This results in a materially higher cost for borrowing money (i.e. a mortgage), thereby lowering the purchasing power for prospective homeowners.
No matter the market activity or moves by The Fed, we advise clients to keep two metrics in mind when purchasing a home:
These are ratios that lenders will use to determine how much you can afford to borrow for a home purchase. In our experience, the thresholds set by lenders are much too high and can leave buyers house poor — spending much of their income on housing and leaving little income available for unexpected or discretionary expenses. Read on for our guidance in determining how much home you can truly afford.
Housing Expense Ratio
The housing expense ratio is determined by dividing monthly housing expenses, including mortgage payment (principal and interest), property tax, and insurance, by monthly pre-tax income. Generally expressed as a percentage, this is number indicates how much of an individual's income is dedicated to paying for housing. While lenders look for a housing expense ratio of less than 28%, we encourage clients to aim for a house expense ratio of 15% or less. At most 20%. This ensures sufficient income after meeting your monthly housing expenses to meet savings goals, absorb unexpected expenses, and allow for discretionary purchases, like eating out, without feeling overly squeezed by your budget.
Debt-to-Income Ratio
The debt-to-income ratio, or housing ratio 2, is very similar to the house expense ratio, but factors in additional household debt. This percentage is calculated by dividing monthly housing expenses, including mortgage payment (principal and interest), property tax, insurance, and any additional debt payments (personal loans, credit card outstanding balances, auto loans, etc.), by monthly pre-tax income. It indicates the portion of income that is spent on household debt. Lenders look for a debt-to-income ratio of less than 36%.
We encourage clients to maintain a debt-to-income ratio of 25% or less. Again, this ensures there is enough income remaining to save for retirement, cover unforeseen expenditures and allow you a lifestyle with some degree of disposable income and flexible spending.
Interest Rates
The Fed has increased benchmark interest rates four times this year. Economists are predicting another 0.75% rate hike later this month, following its scheduled Federal Open Market Committee (FOMC) meeting on September 20-21. With each increase, it is easy to feel the frenzie of buyers trying to get into the market before rates climb again.
If you are feeling pressure to buy, it’s helpful to note that even today’s interest rates are historically low. According to data compiled by Freddie Mac, the average interest rate for a 30-year fixed mortgage from 1971 to present is 7.74%.
Recalling the inverse relationship of interest rates and housing prices brings further context2. As we saw in 2021, unprecedentedly low interest rates brought a surge in the pricing of homes. While rates creep back up, housing prices are moving down. There is always the option to refinance your mortgage when interest rates eventually cycle down, but you won’t ever be able to change the purchase price.
It is impossible to predict what will happen in the market, but using current data to calculate a few metrics can ensure your home purchase won’t leave you overextended. If you are considering a home purchase in the near future, contact your Skyline advisor to determine how these metrics inform your specific situation.


